
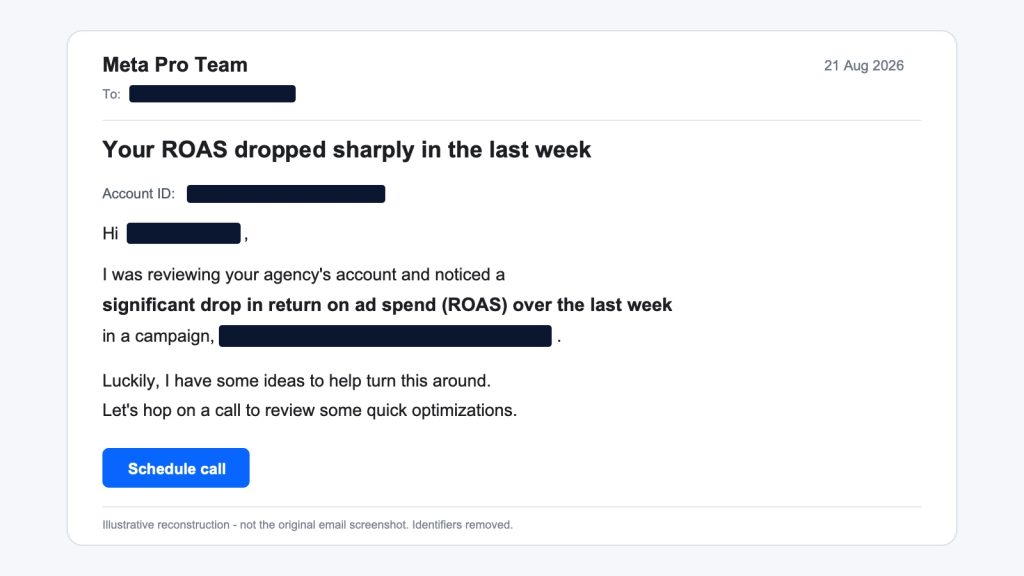
A Meta representative warned that ROAS had dropped sharply. A later account-wide point showed both spend and purchase ROAS higher.
An eCommerce business received a Meta Pro Team email saying that return on ad spend had dropped significantly during the previous week in one campaign. The message invited the business to schedule a call for quick optimizations.
We checked the claim against the recording supplied with the case. In the account-wide daily report, spend moved from $432.46 on August 15 to $475.40 on August 21, while purchase ROAS moved from 2.28 to 3.64. That is approximately 10% more spend and 60% higher purchase ROAS between those two daily points.
The later account-wide point did not match the wider-account implication a reader could take from the warning. It was still not enough to declare the campaign-level warning false, because the email and the recording used different scopes.
What the representative’s email claimed
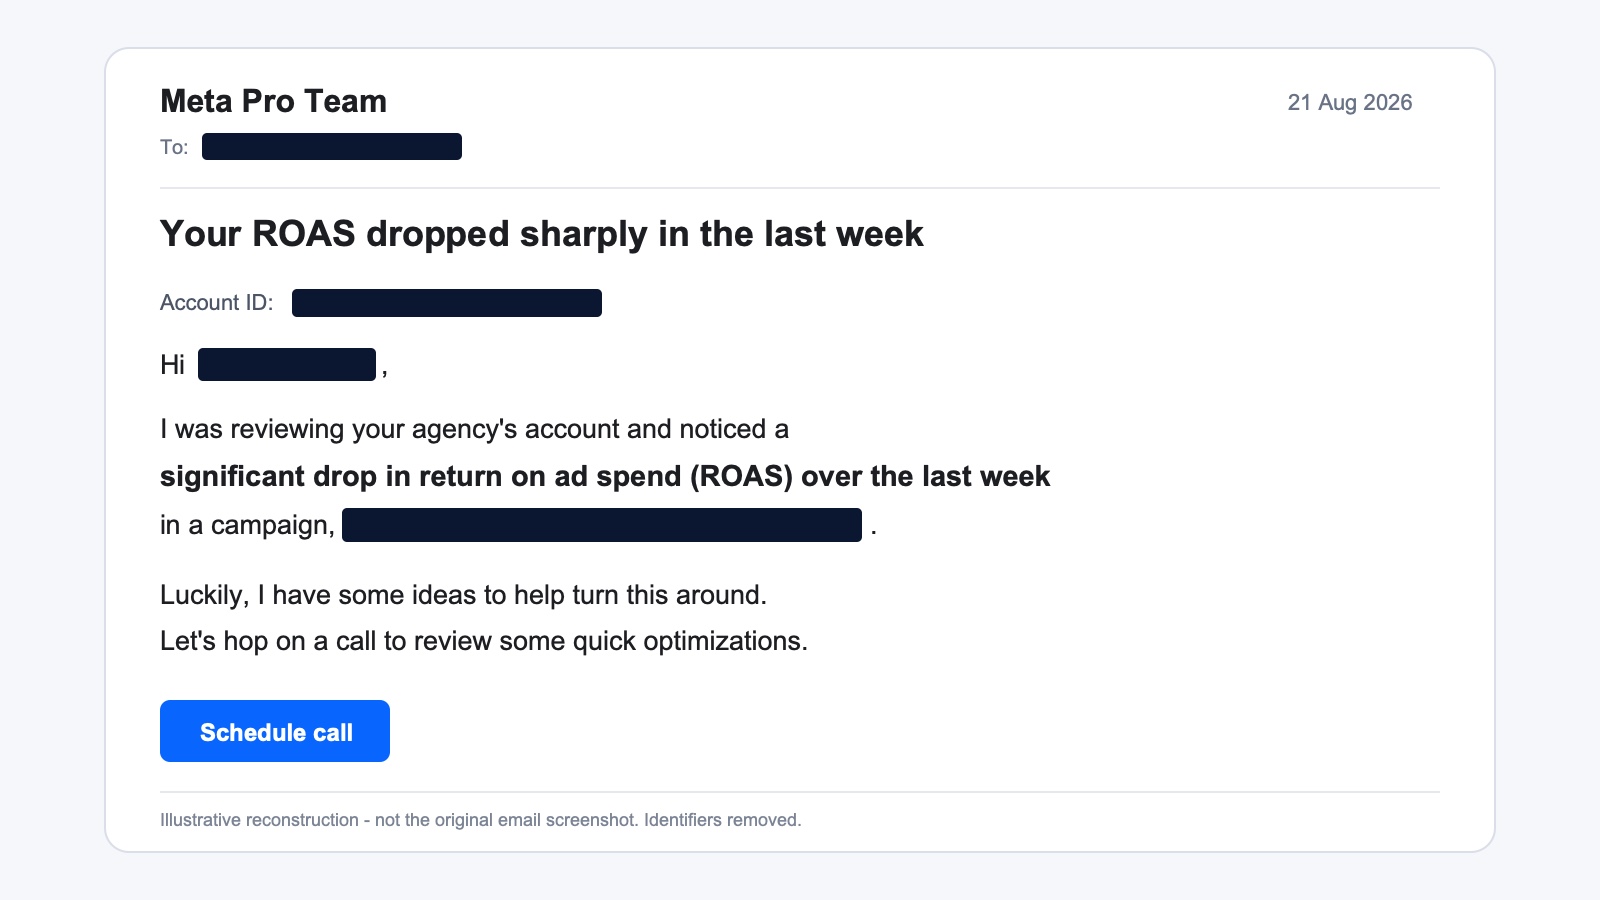
The email identified one campaign and described a significant ROAS decline over the previous week. It did not include the exact start and end dates, comparison baseline, account timezone, or attribution setting used for that conclusion.
That made the message a useful prompt to inspect the account, but not a sufficient instruction to change budgets, creative, targeting, or campaign structure.
What the account-level check showed
The recording contained two exact account-wide daily points that bracketed the final part of the period:
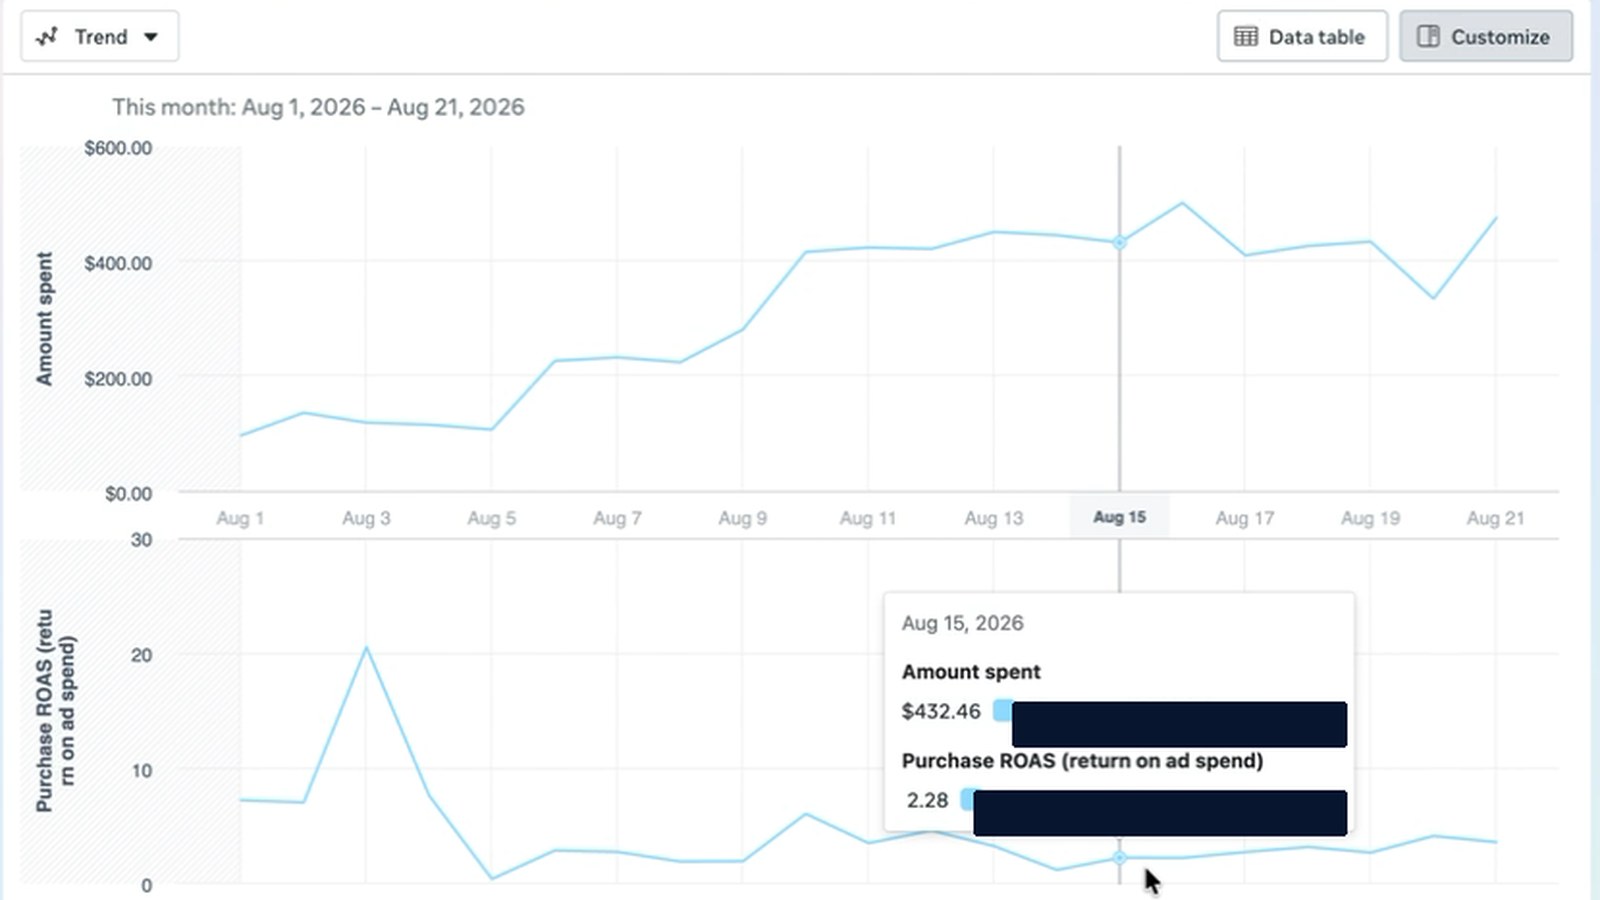
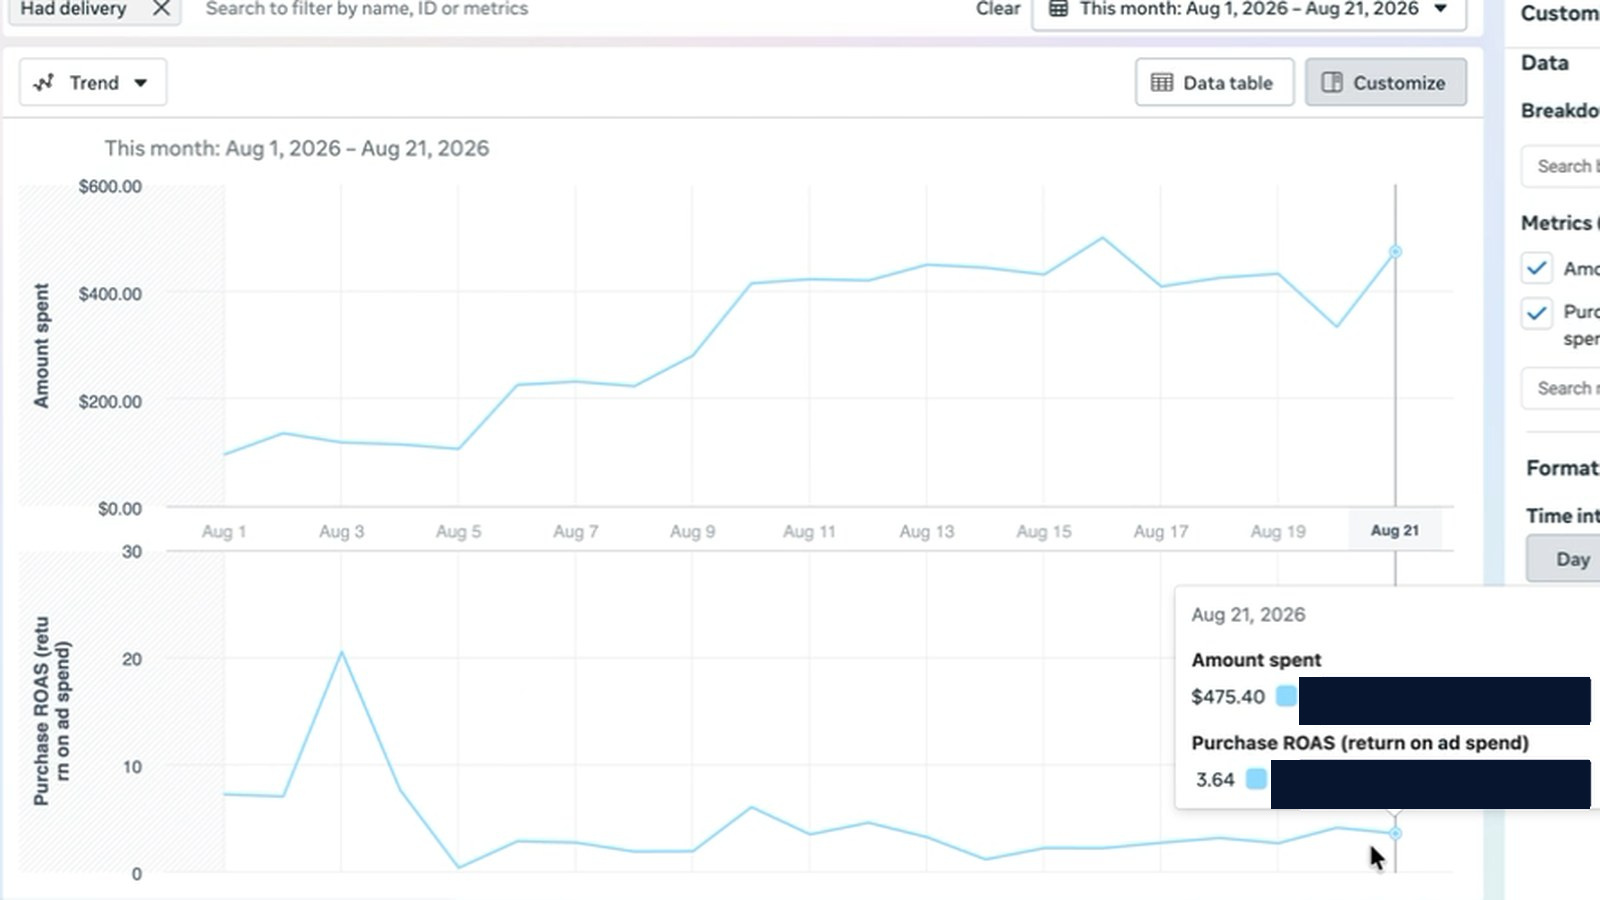
- Amount spent: approximately +10%, from $432.46 to $475.40.
- Purchase ROAS: approximately +60%, from 2.28 to 3.64.
This is the central account-level observation. The business was spending more at the ending point, and the purchase ROAS shown by Meta was also higher. The daily line was not perfectly monotonic, so the responsible description is that both metrics finished higher between the two observed points, not that they rose every day.
What the matched commerce view showed
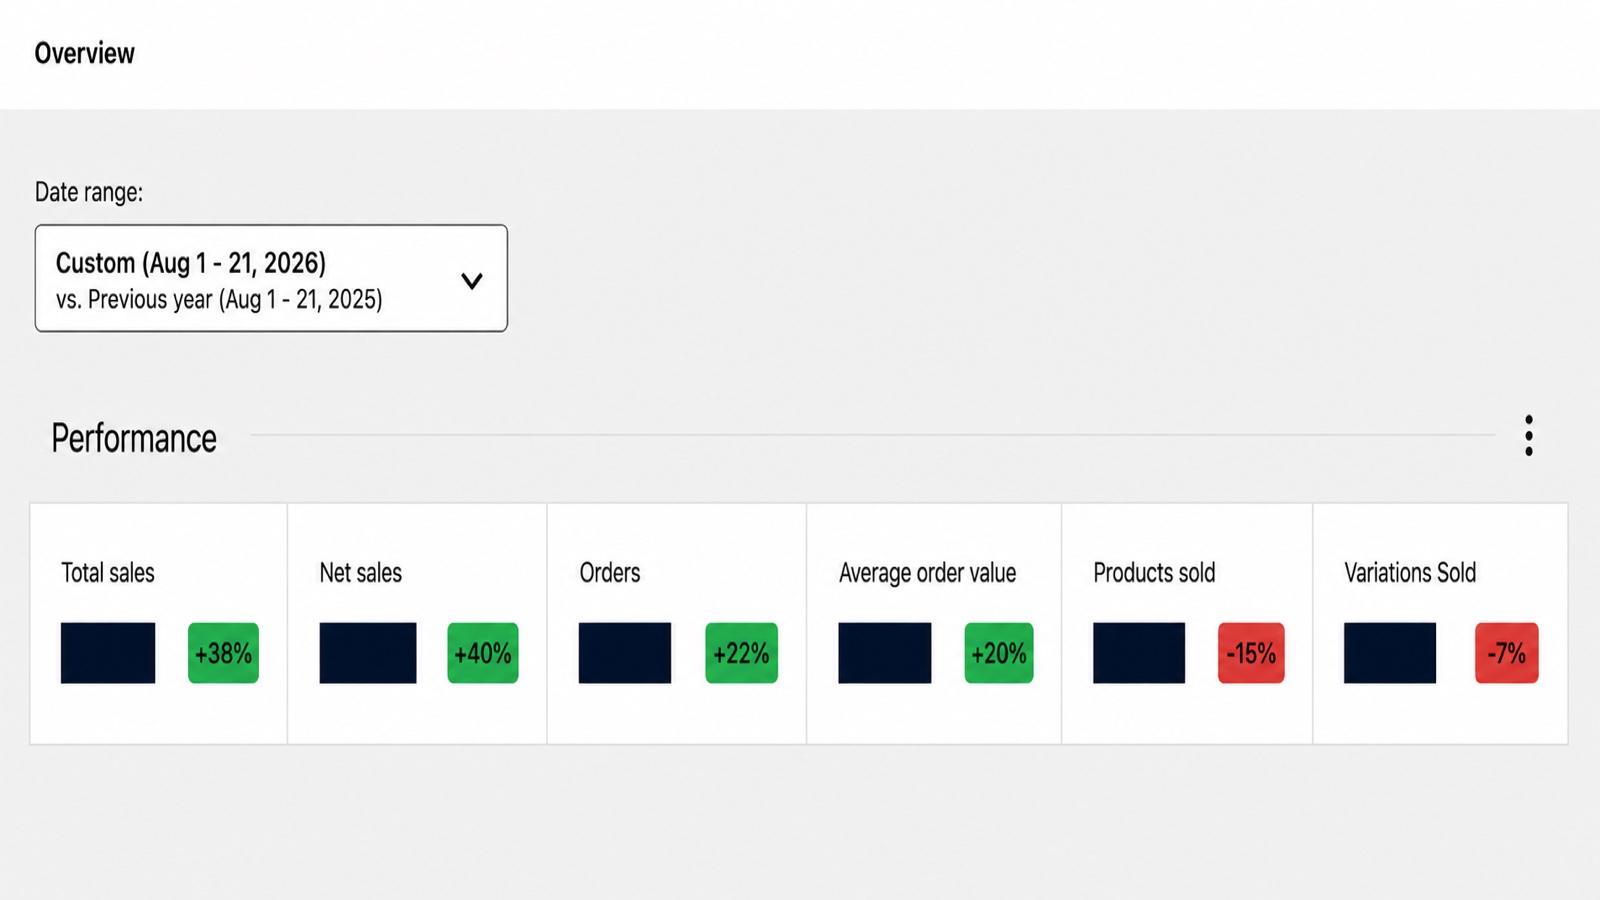
For August 1-21, 2026 compared with August 1-21, 2025, the commerce system showed:
- Total sales: +38%.
- Net sales: +40%.
- Orders: +22%.
- Average order value: +20%.
- Products sold: -15%.
- Variations sold: -7%.
This was a materially stronger year-over-year commerce-system picture. It was not a doubling of sales, and it did not prove that Meta caused the growth.
The decline in units alongside stronger sales and average order value suggests that product mix, price, or basket composition may have mattered. The supplied evidence does not isolate which explanation was responsible.
Why the scope difference still matters
The email referred to one campaign and an unspecified previous-week comparison. The recording showed account-wide daily points and a matched store-level year-over-year comparison. Those are three connected views, but they are not interchangeable:
- Campaign signal – the narrow claim in the outreach email.
- Account comparison – the later August 21 point showed more spend and higher purchase ROAS than the checked August 15 point.
- Commerce-system observation – stronger matched-period commerce results year over year.
The later August 21 account-wide point directly challenges the idea that the wider Meta account was deteriorating relative to the checked August 15 point. It does not reproduce the representative’s exact campaign calculation, so it does not prove that the representative’s campaign-level statement was false.
The practical mistake would be to act on the platform alert without checking:
- the exact campaign, ad set, or account covered;
- the complete dates and comparison period;
- the attribution setting, timezone, and conversion definition;
- the account-wide spend and ROAS comparison;
- the commerce result for matched periods; and
- changes in pricing, promotions, inventory, tracking, creative, budget, or other channels.
The operating lesson
Platform alerts should open an investigation, not close the decision.
In this case, the later account-wide point showed more spend and higher purchase ROAS, while the matched commerce-system observation was also stronger. That was enough to reject the alert as a complete account or business diagnosis.
This is the same discipline behind our Meta Ads and Paid Social work and our Conversion Tracking and Attribution work. The objective is not to defend a platform report. It is to help the business make a better acquisition decision.
For another example of separating platform reporting from the underlying measurement system, see how we rebuilt the signal path for an eCommerce retailer, or browse our paid growth case studies.
Is a platform warning telling a different story from your account and business data?
Method and limitations: Shopping Ads Solutions reviewed one exact client-forwarded Meta Pro Team email and one 141-second screen recording created on August 21, 2026. The account comparison uses the visible August 15 and August 21 daily points in the recording: spend moved from $432.46 to $475.40 and purchase ROAS from 2.28 to 3.64. The commerce view compares August 1-21, 2026 with August 1-21, 2025. Client identity, account details, domains, and raw commerce values are removed or irreversibly masked. The observations do not prove that the campaign-level alert was false, that Meta caused the commerce result, or that the same pattern applies to other businesses. Promotions, pricing, inventory, other channels, tracking changes, and other confounders were not reconciled in the supplied evidence.