

A fashion product can be technically “in stock” while being commercially unavailable to most of the people who normally buy it.
That is the problem we were trying to control in this anonymized Google Ads account. The campaign could still advertise a design because several fringe sizes remained available. But if the sizes responsible for most historical purchases had sold out, the commercial probability behind the click had changed substantially.
The answer was not a one-time campaign adjustment. It was a continuously operating inventory rule that changed which designs remained eligible for advertising as stock weakened.
The commercial context
- Market: United States
- Niche: Fashion eCommerce
- Sub-niche: Swimwear
- Channel analyzed: Google Ads / Shopping inventory
- Observed period: 27 April–26 July 2026
- Confidentiality: Client identity remains anonymous
Evidence note — updated August 6, 2026: This Shopping Ads Solutions first-party analysis combines Michael Chachashvili's operating explanation with a Google Ads screenshot, a 91-day time-series export and an ad-group export covering April 27 through July 26, 2026. Michael approved anonymized publication. The brand, products, account identifiers, daily stock snapshots and design-level exclusion history remain private or were not available. The 70% example below is illustrative, and the campaign export has no clean intervention date or control group; reported conversion value is not net revenue or profit.
This distinction matters because fashion inventory is not equally valuable across every size. For many designs, a small number of sizes account for a disproportionate share of purchases. The sizes are not merely product attributes; they are part of the demand available to the campaign.
Why “in stock” was not a useful enough signal
Google requires merchants to submit accurate availability for individual products and variants. Apparel variants can be grouped under the same item group while each size is submitted separately. That is important feed hygiene, but it does not answer the commercial question we needed to answer.
The standard availability field tells Google whether a particular offer can be purchased. It does not express how much historical demand remains across the complete size curve of the design.
A shopper can therefore see an apparently available design, click the ad and only then discover that the size they need is unavailable. The click was valid. The feed was not necessarily wrong. But the probability of turning that click into revenue was no longer the probability the design had when its core sizes were available.
That is the gap between technical availability and demand-weighted availability.
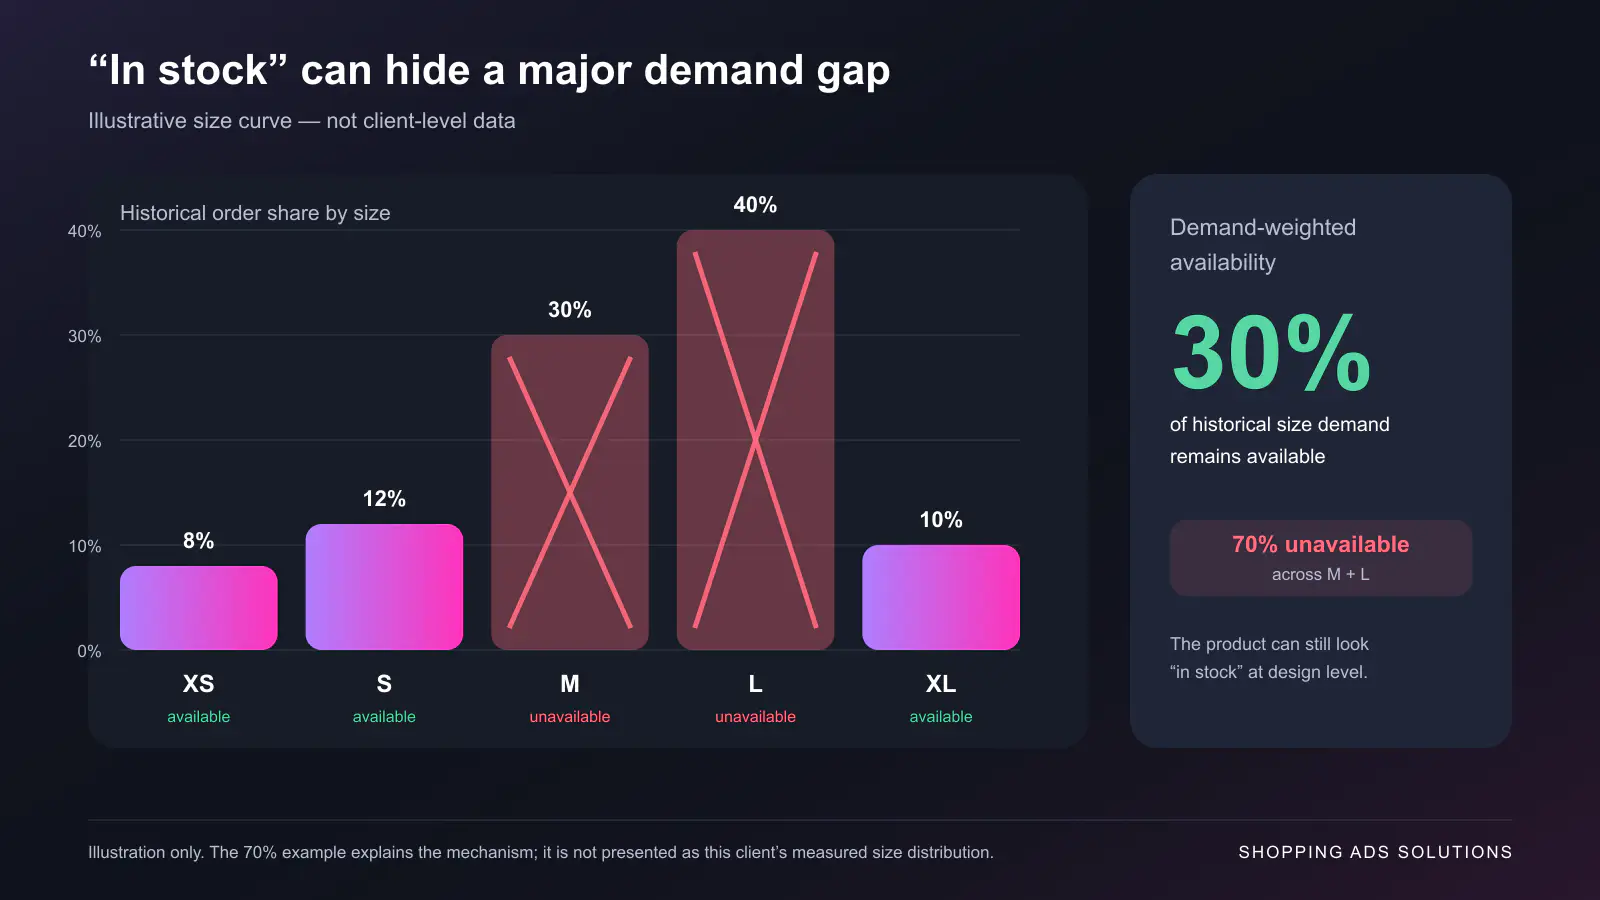
The 70% example is a model, not a performance claim
Suppose two core sizes historically represented 70% of a design's sales. If both sold out while the remaining sizes stayed available, the design would still be “in stock.” Yet only 30% of its historical size demand would remain covered.
If size demand stayed stable and shoppers did not substitute, the theoretical conversion opportunity could fall to roughly 30% of its previous level—a 70% reduction. At the same click cost, the inverse cost per outcome would be approximately 3.33 times higher. That would not mean Google Ads had suddenly become worse; it would mean the purchasable inventory no longer matched most of the demand that had made the design successful.
That calculation is a decision model. It is not the measured result of this account. Buyers sometimes choose another size or design, historical order share is not identical to future click preference, and promotions or seasonality can change the distribution. We used the model to identify a commercial risk worth controlling, not to manufacture a result.
We changed eligibility at the design level
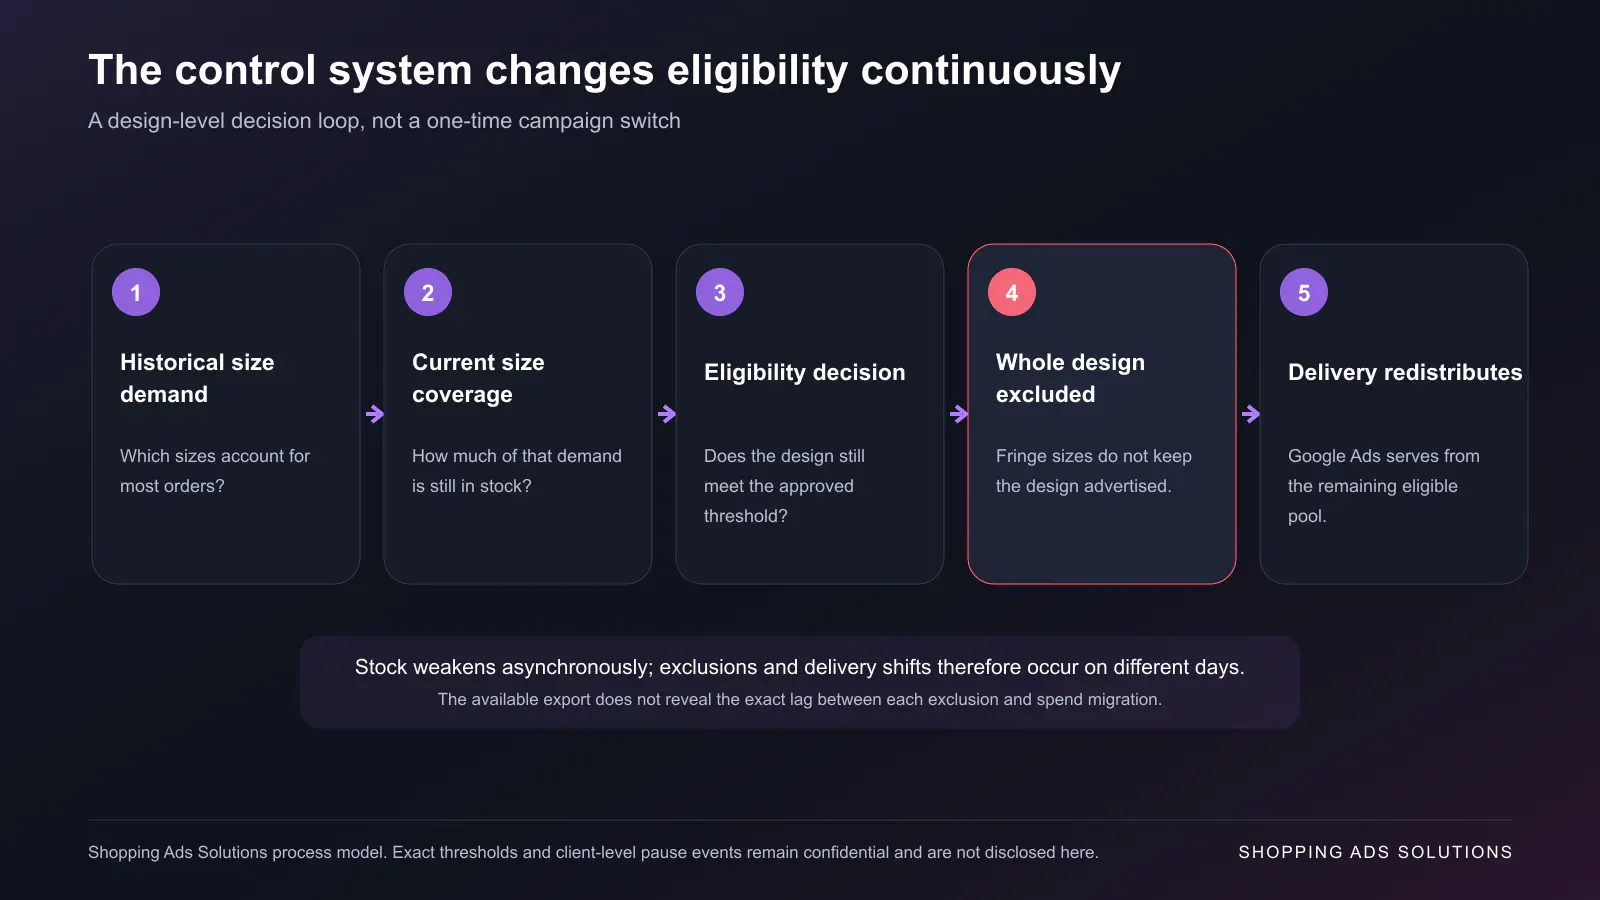
The operating rule looked beyond whether at least one variant remained available. It evaluated whether enough of the historically important size demand was still covered.
When a design no longer met the approved coverage logic, the whole design became ineligible for advertising. We did not preserve ad delivery merely because uncommon sizes were still sitting in stock.
That decision had two purposes:
- Reduce spend on designs whose remaining inventory had a materially weaker chance of matching real demand.
- Leave more delivery opportunity for designs with a healthier set of available sizes.
It did not guarantee that another design would sell as well as the excluded one. A historically successful product cannot transfer its demand to a different product by command. The narrower conclusion was more defensible: a design with meaningful sizes available had a better commercial probability than one whose best-selling sizes had already disappeared.
There was no single “switch” on 25 May
The rule was active before the period covered by the export. This means we cannot treat 25 May as an implementation date or compare the weeks before and after it as a clean experiment.
Stock changed every day. One design could lose a core size on Monday, another could cross the rule later in the week, and a third could remain commercially healthy. Each exclusion changed the set of products Google Ads was allowed to serve.
Delivery then shifted across the remaining eligible inventory over subsequent auctions. That redistribution was not an instantaneous, isolated event, and the campaign export does not reveal its exact lag.
One plausible explanation for the movement visible around the week of 25 May is that several designs became ineligible shortly before or during that period, after which spend flowed toward designs with stronger availability. But without the design-level pause history and daily stock snapshots, that remains a hypothesis—not a fact.
What the campaign data actually shows
Across the 91-day reporting period, Google Ads recorded:
- $6,391.77 in spend
- 11,979 clicks
- 386.46 reported conversions
- $27,422.36 in reported conversion value
- 4.29 conversion value divided by cost
Weekly reported return fluctuated substantially, from 0.10 to 6.86. Spend also increased as the period developed. Those movements show an account whose delivery and outcomes changed over time; they do not isolate the effect of the inventory rule.
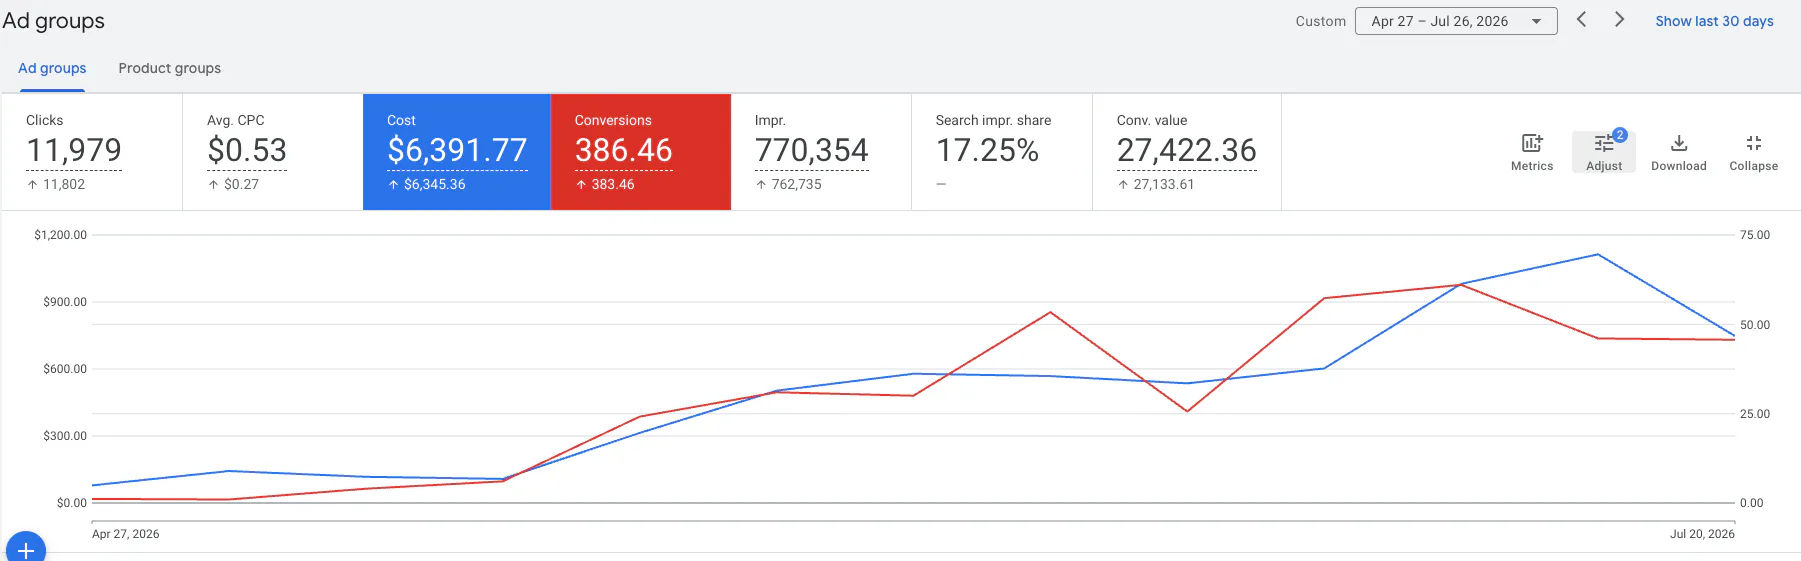
The original account view is useful evidence, but its two selected series do not isolate the stock-control mechanism. The simplified weekly chart below places spend beside Google Ads-reported conversion value divided by cost while retaining the same limitation: it is an operating timeline, not a controlled before-and-after experiment.
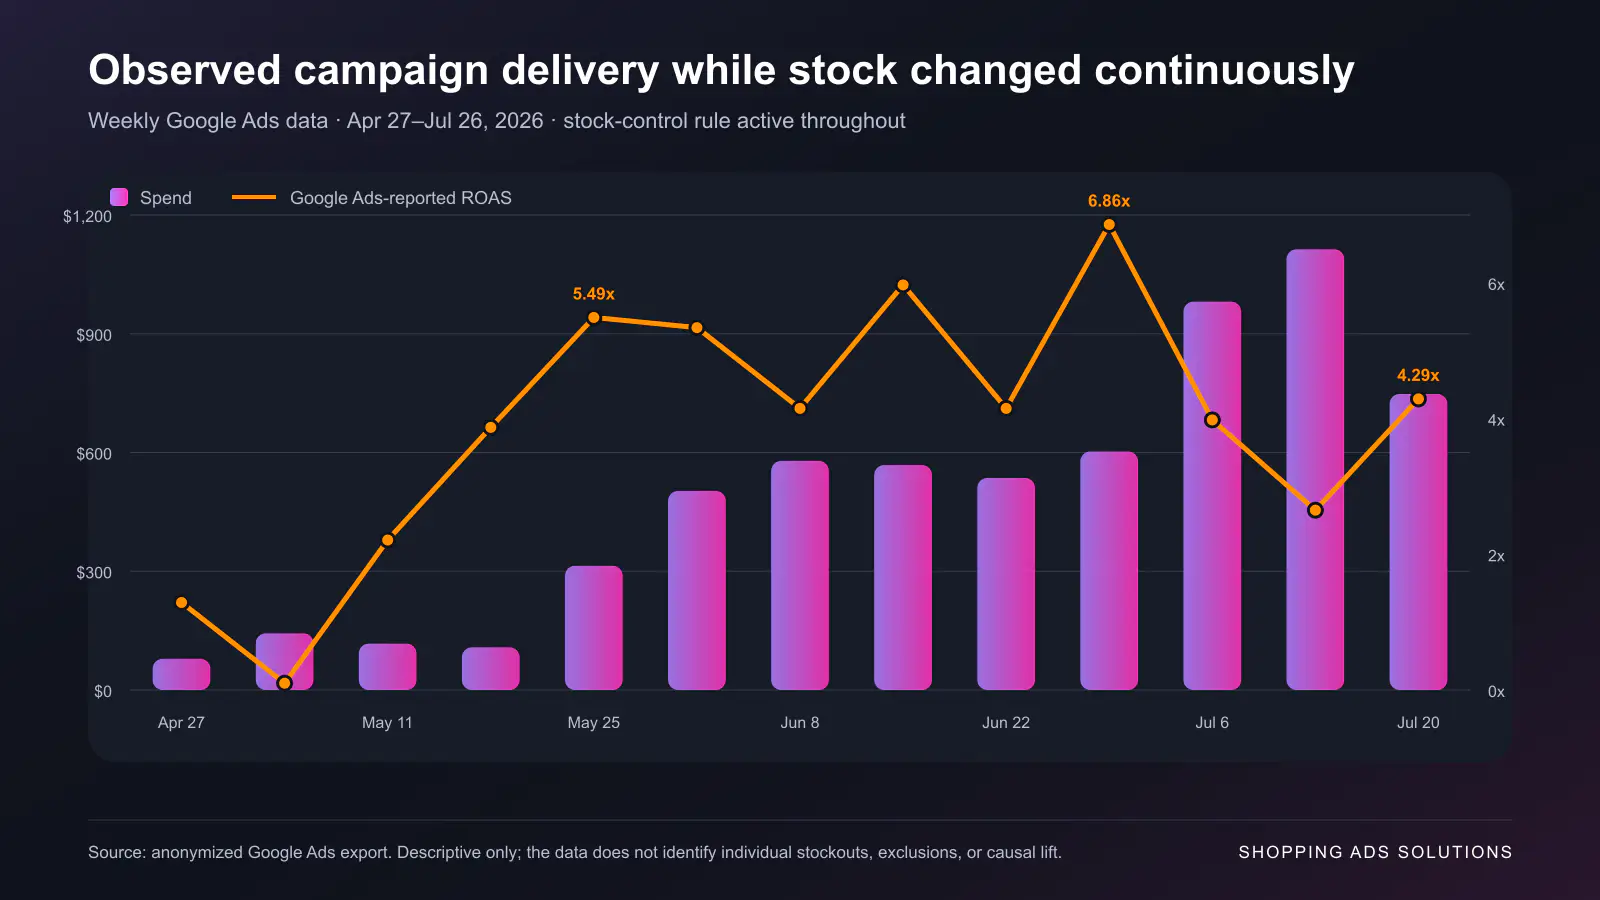
This is why we will not present the account's reported 4.29 ratio as “the result” of the rule. The export does not provide a counterfactual showing what would have happened if those designs had remained eligible. Nor does it identify exactly which design lost stock on which day.
The evidence supports the operating logic and the campaign context. It does not support a causal lift claim.
The real advertising input was the inventory behind the feed
The important decision was not whether to raise or lower one bid. It was deciding which products still deserved access to the advertising budget.
For a size-based catalog, availability should not be treated as a binary switch detached from merchandising. We need to understand:
- Which sizes historically carry the demand.
- How much of that demand remains covered today.
- Whether the remaining variants justify continuing to advertise the complete design.
- How exclusions change the eligible product pool over time.
- Whether the resulting delivery still produces commercially valuable orders.
That is the broader principle behind the work: advertising performance is produced by the commercial system around the campaign. Inventory depth, product demand, feed eligibility and automated delivery interact. Looking at the campaign alone would have hidden the constraint that mattered. This is part of how we connect media to the wider customer-acquisition system.
When your feed says “available” but the business says otherwise
If an eCommerce brand is spending seriously on Google Shopping while important variants sell out unevenly, a technically correct feed may still be commercially too permissive.
Shopping Ads Solutions' paid growth audit examines advertising beside the product, inventory and order evidence it is meant to monetize. The purpose is not to hand over a generic checklist. It is to identify where the current system is allowing budget to follow a weaker commercial probability—and what should be tested next. Request the paid growth audit here.
If we subsequently work together, the audit fee is credited toward the agreed engagement.
About the author: Michael Chachashvili is a founder of Shopping Ads Solutions and works on paid acquisition, measurement, and profitable growth systems for eCommerce and service businesses. Published August 5, 2026; updated August 6, 2026.