

The additional Google Ads budget bought substantially more reach, but the resulting traffic produced weaker orders and less revenue. The comparison showed where the deterioration concentrated; it did not prove that one campaign setting caused every change.
The business nearly doubled its advertising spend.
This was an established eCommerce brand operating in the United States:
- Market: United States.
- Niche: Home & Garden.
- Sub-niche: Solar-powered outdoor lighting, including lamp-post, wall, path, and landscape lighting.
Evidence note — updated August 6, 2026: This is a Shopping Ads Solutions first-party analysis of anonymized Google Ads and WooCommerce exports comparing matched 2025 and 2026 periods for a US solar-powered outdoor-lighting brand. Figures are rounded. Completed and processing orders were included; the later file contained more processing orders. The client approved anonymized publication, while the raw exports remain private. This observational comparison can locate where commercial deterioration concentrated, but it cannot prove causation or isolate one campaign setting as the cause.
That context mattered. The account contained branded and generic demand, established and newer product groups, individual-item and multi-item orders, and a relatively small number of premium purchases that contributed a disproportionate share of revenue.
Its share of available Google Ads impressions rose from approximately 31% to 74%. It was considerably more visible in the auction and attracted substantially more generic search traffic.
Yet store revenue declined. Google Ads-attributed sales fell much more sharply.
The immediate temptation was to ask what had gone wrong inside the campaigns. But the campaign dashboard was showing the symptom, not the full commercial problem.
The more useful question was:
What kind of traffic did the additional budget buy—and what kind of customers and orders did that traffic produce?
That question changed the investigation.
The short version: The business did not simply lose demand. It bought more reach while capturing less high-intent branded traffic. The resulting orders contained fewer items, included fewer premium purchases, and relied more heavily on discounts. More visibility had not produced better customer economics.
The signal: more investment, weaker business results
We began with several exports comparing the account's 2025 and 2026 performance.
At the highest level, the situation looked contradictory:
- Advertising spend was close to twice as high.
- Auction visibility increased dramatically.
- Generic impressions and clicks increased.
- Conversion volume and value declined.
- Net store sales fell by approximately 10%.
There were several plausible explanations.
Competition may have made the traffic more expensive. Demand may have weakened. Tracking may have changed. New campaigns or products may have absorbed spend before they were ready. The website may have converted less effectively. Or the business may simply have attracted a different mix of buyers.
Any one of those explanations could have led to a different decision. That is why we did not begin by restructuring campaigns.
We began by separating what we knew from what still had to be explained.
More visibility was not the same as more valuable demand
Auction data initially appeared positive. The account's impression share had increased from approximately 31% to 74%.
The business was not disappearing from Google. It was appearing much more often.
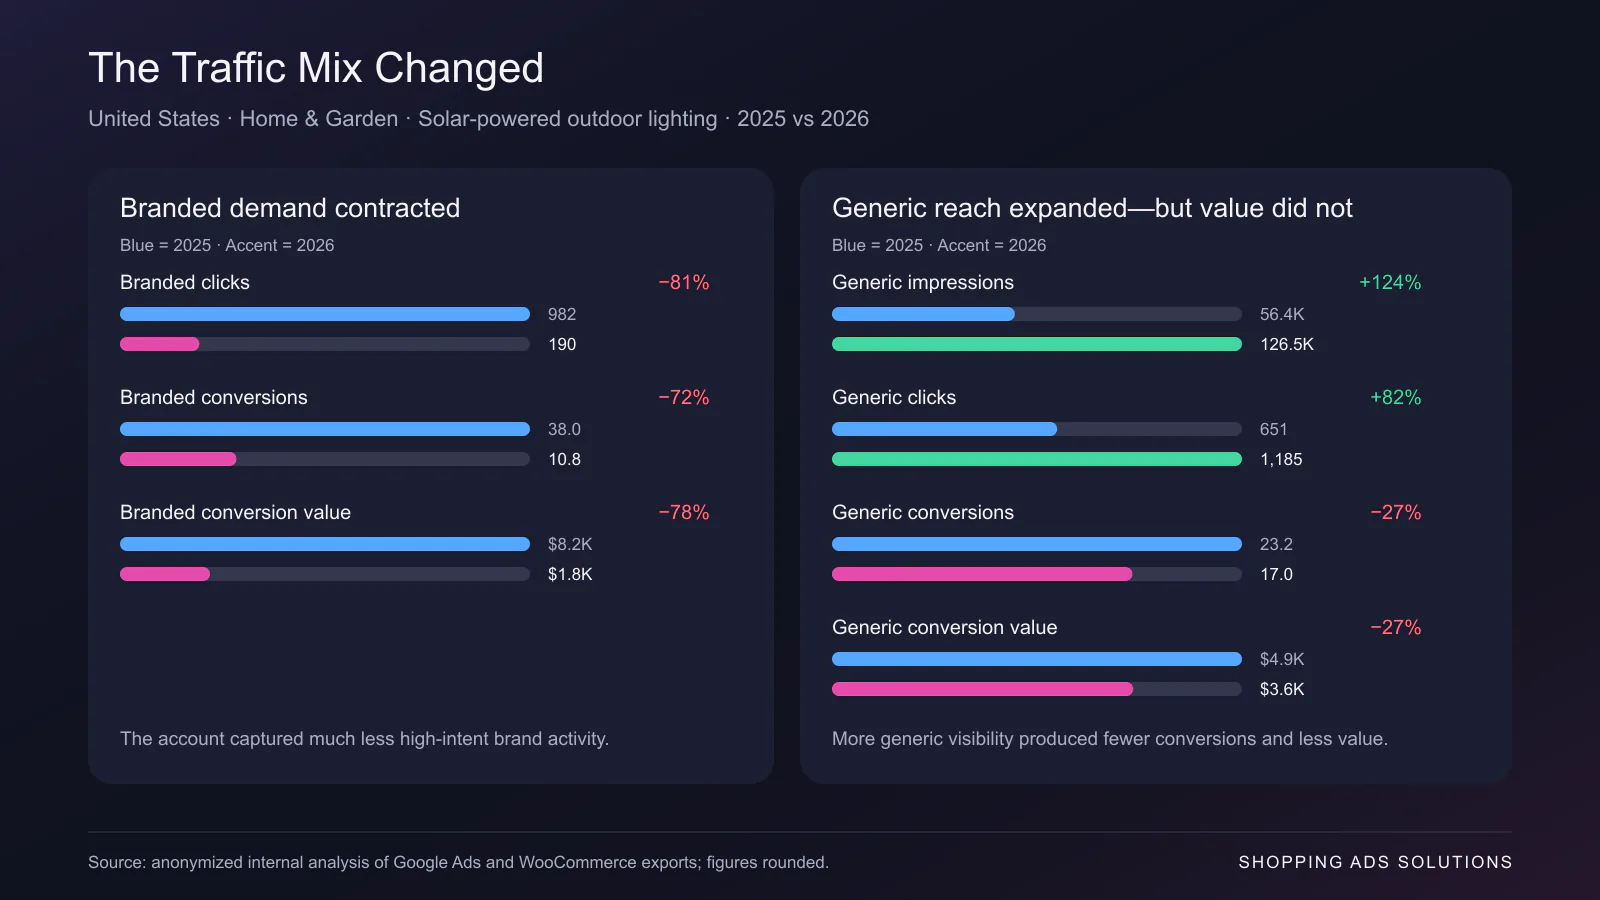
Generic search impressions increased from roughly 56,000 to 126,000, while generic clicks rose from approximately 650 to 1,185. But the commercial outcome moved in the opposite direction:
- Generic conversions declined from approximately 23 to 17.
- Generic conversion value declined from approximately $4,900 to $3,600.
- Overall search-term conversion rate fell from approximately 3.75% to 2.02%.
- Value per click fell from approximately $8.03 to $3.92.
The account had succeeded at buying more exposure and more visits. It had not succeeded at buying more valuable demand.
This is an important distinction. A traffic increase can look like progress inside an advertising platform while weakening the economics experienced by the business.
The high-intent traffic moved in the opposite direction
While generic traffic expanded, branded demand capture weakened.
Across the brand-related search terms we reviewed:
- Clicks fell from approximately 982 to 190.
- Conversions fell from approximately 38 to 11.
- Conversion value fell from approximately $8,200 to $1,800.
One core branded query accounted for a large part of the decline.
This did not prove that branded traffic alone caused the entire performance drop. It did, however, show that the account's composition had changed materially. A much larger share of activity was now coming from broader searches, while the traffic most closely connected to existing brand intent had contracted.
The correct next step was therefore not simply “get more clicks.” The business was already getting more clicks.
We needed to understand whether budget, rank, campaign overlap, broader matching, product targeting, or another account change had altered the balance between high-intent and exploratory traffic.
The order data made the change impossible to dismiss
Advertising data can tell us what happened before a purchase. It cannot tell us enough about the quality of the purchase itself.
We placed the WooCommerce order data beside the Google Ads data.
Across the store, average order value—revenue divided by order count—fell by only 2%. If we had stopped there, we might have concluded that order quality was largely stable.
It was not.
The number of items per order fell by approximately 14%, and the number of items sold fell by more than 20%. Orders above $1,000 declined from eight to three. Those premium orders had previously represented more than 42% of sales; in the later period, they represented 27%.
The business had not merely generated slightly smaller orders. It had lost a meaningful part of the order mix that disproportionately produced revenue.
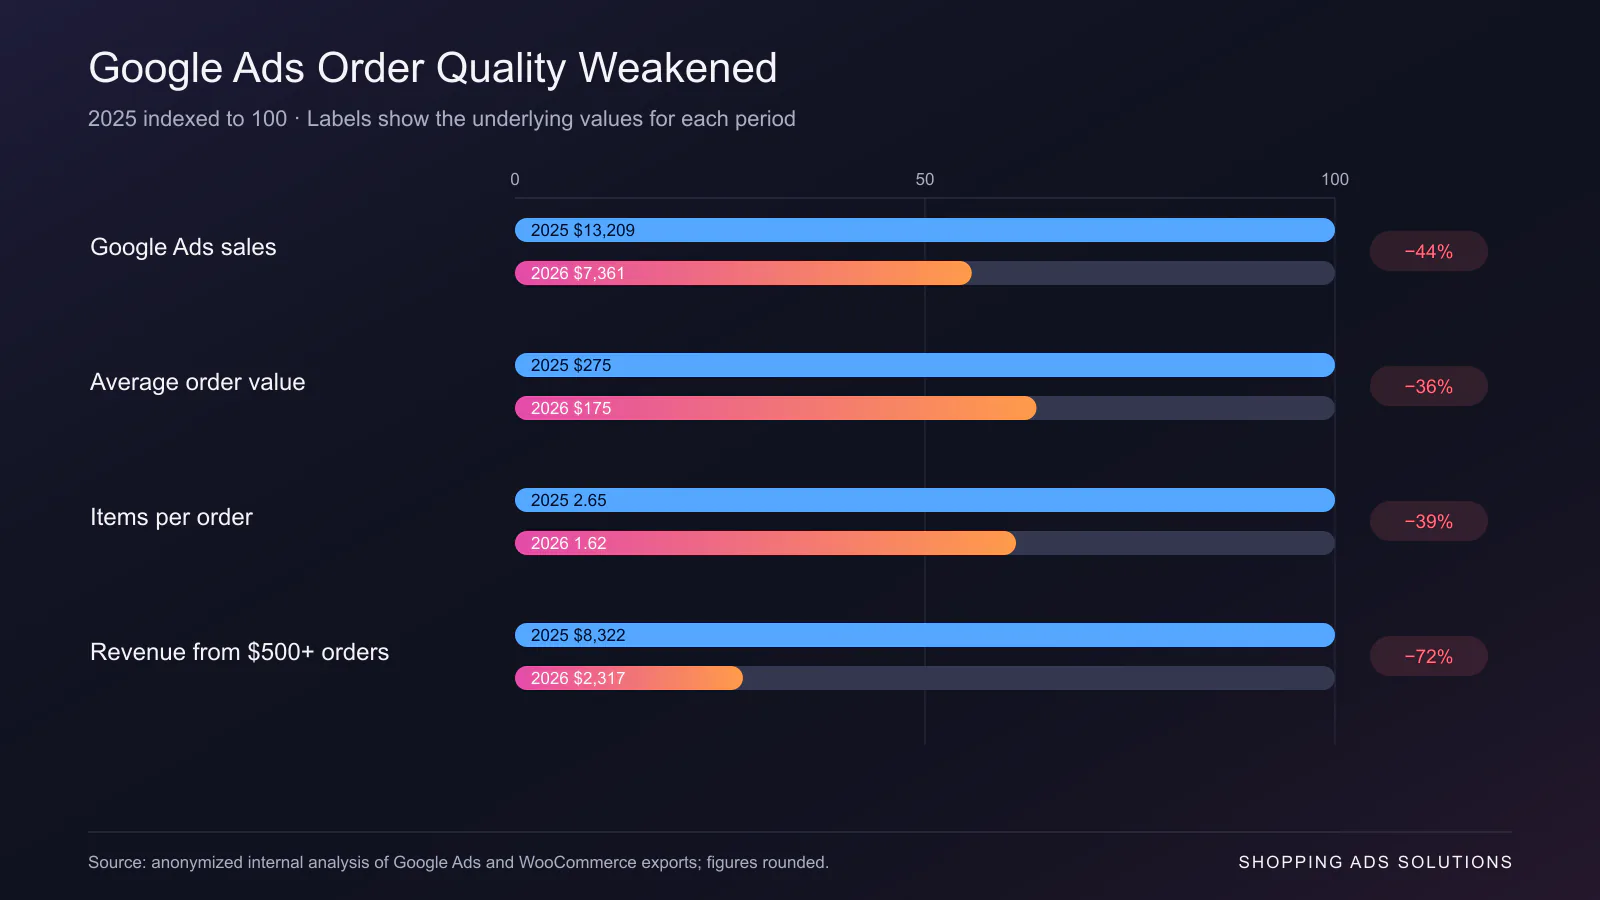
The Google Ads-attributed orders were weaker still:
- Orders fell by approximately 13%.
- Sales fell by approximately 44%.
- Average order value fell from approximately $275 to $175.
- Items per order fell from approximately 2.65 to 1.62.
- Revenue from Google Ads orders worth $500 or more fell from approximately $8,300 to $2,300.
That was the commercial change hidden behind the top-line campaign metrics.
Google Ads was not only producing fewer sales. It was producing fewer large baskets and much less premium-order revenue.
Discounting and retention added another layer
The customer and promotion data did not support a simple “advertising problem” explanation either.
Coupon usage rose sharply:
- Coupon orders increased from roughly 14% to 39% of all orders.
- Coupon-driven sales increased from approximately 45% to 62% of total sales.
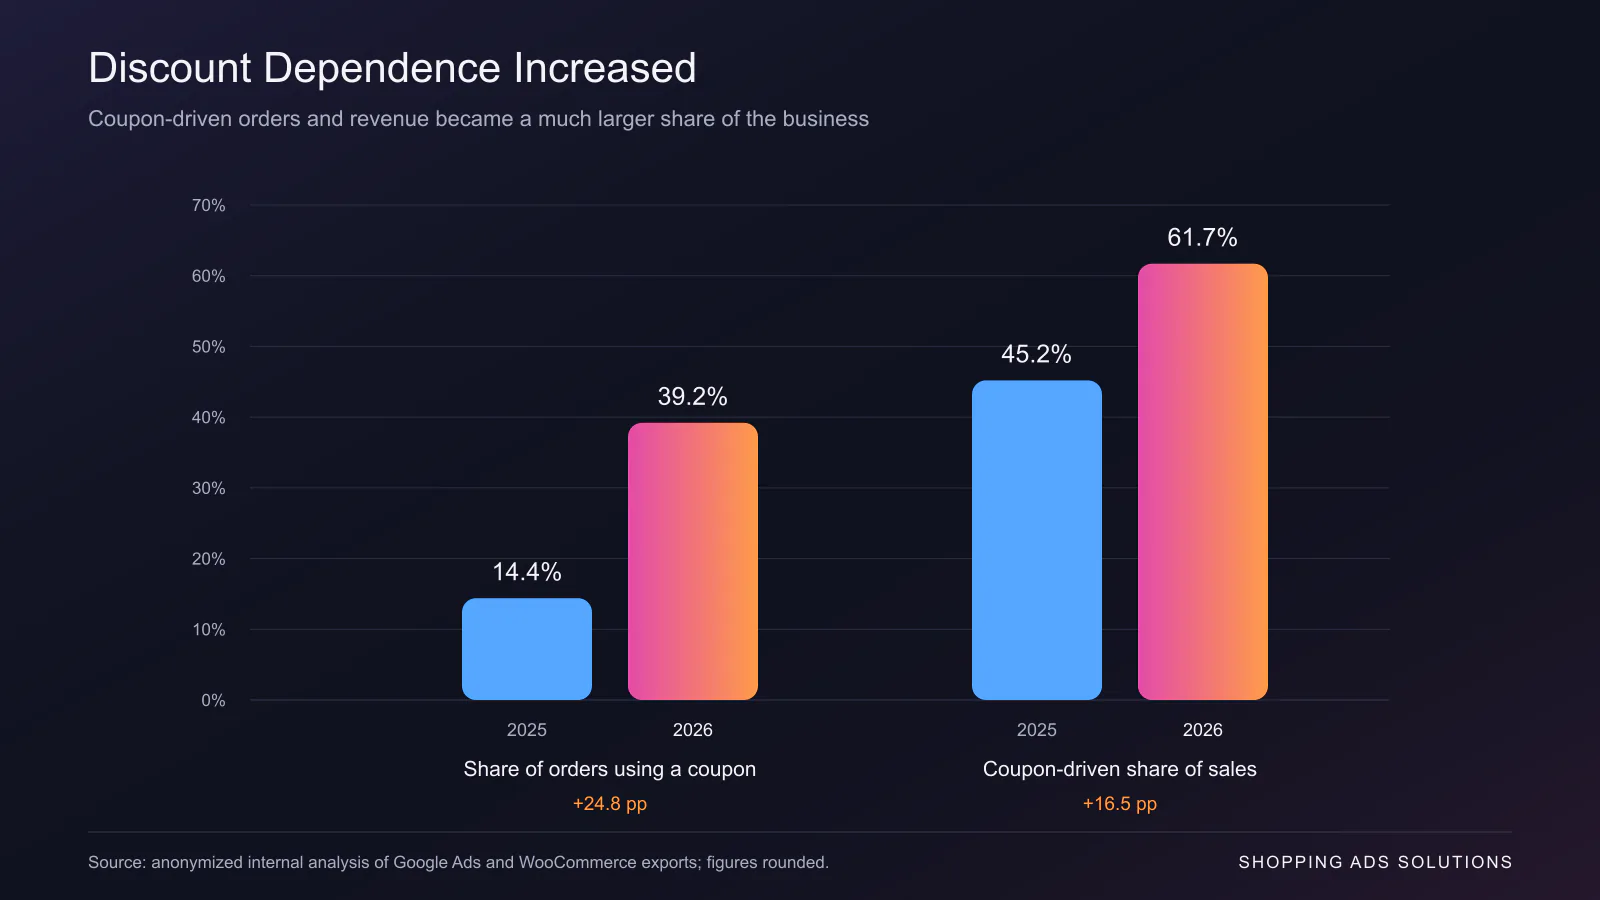
That may indicate that more customers needed an incentive to buy, that the traffic was more promotion-sensitive, or that the commercial calendar had changed. The data alone could not tell us which explanation was correct, so we treated those possibilities as hypotheses rather than conclusions.
Retention also softened. Orders attributed to retention fell from 28 to 16. Returning-customer order volume declined, although revenue from the returning customers who did purchase remained relatively resilient.
This suggested a frequency problem more than a complete loss of customer value: fewer returning customers were buying, but the ones who did were still meaningful.
Acquisition and retention could not be assessed as separate systems. The business was paying more to acquire traffic while receiving less support from repeat-purchase volume.
What the evidence supported—and what it did not
The combined evidence supported a clear diagnosis:
The later traffic mix, especially from paid Google, appeared less qualified and less premium than the earlier traffic mix.
It produced:
- Less branded, high-intent capture.
- More generic visibility without proportional conversion growth.
- Fewer high-value orders.
- Fewer items per order.
- Weaker Google Ads revenue per order.
- Greater dependence on coupon-driven purchases.
But this was still observational business data, not a controlled experiment.
The exports also contained a status difference: the later WooCommerce file included more processing orders than the earlier file. We included completed and processing orders in the comparison, but the timing difference meant that every number needed to be interpreted with care.
The analysis could tell us where the commercial deterioration was concentrated. It could not, by itself, prove that one campaign setting caused every change.
That distinction matters. Strong analysis should narrow the next decision without pretending that correlation is causation.
What changed after the investigation
The investigation changed what deserved priority.
Instead of treating the account as a general conversion-volume problem, the next decisions became more specific:
-
Understand the loss of branded capture.
We needed to separate budget, rank, campaign overlap, and query-routing explanations before deciding how brand demand should be protected. -
Separate proven products from expansion inventory.
Newer and broader product groups had received more spend without reproducing the economics of the established products. They needed different expectations and controls. -
Evaluate traffic by the orders it produced.
Conversion count alone was not sufficient. Revenue per click, basket depth, premium-order share, product mix, and new-versus-returning customer behavior had to sit beside platform metrics. -
Understand the role of discounting.
The business needed to know whether promotions were creating incremental demand or compensating for weaker traffic and offer fit. -
Reconnect acquisition and retention.
A decline in repeat-purchase frequency changed what the business could rationally afford to pay for a new customer.
This was not a cosmetic reporting change. It altered the order in which we would investigate and test the account.
The lesson was not “spend less”
The conclusion was not that increasing budget is inherently wrong.
Larger budgets can accelerate learning and capture more demand. But they can also expand an account into weaker searches, less proven products, and less valuable customer segments. The budget creates more observations; it does not guarantee that those observations will be commercially useful.
The decision to scale should therefore be based on more than platform conversion value or aggregate return on ad spend.
We need to know:
- Which demand the account captured.
- Which products and customers generated the revenue.
- Whether buyers needed larger incentives.
- Whether baskets became deeper or shallower.
- Whether valuable customers returned.
- Whether the business made more money from the additional reach.
That is why we evaluate advertising as part of the full commercial system—not as an isolated campaign structure. See how our customer-acquisition work connects traffic to commercial outcomes.
When the advertising dashboard and the business disagree
If spend and visibility are rising while the business feels weaker, rebuilding campaigns may eventually be part of the answer.
It should not automatically be the first answer.
First, we need to locate the change: tracking, intent, product mix, basket economics, discounting, retention, website behavior, or some combination of them. Only then can a test address the problem the business actually has.
That is the purpose of the Shopping Ads Solutions paid growth audit. We examine advertising beside the commercial evidence it is meant to produce. Request the audit here. If we subsequently work together, the audit fee is credited toward the agreed contract.
The objective is not another list of platform recommendations.
It is a defensible answer to a more valuable question:
What changed in the business—and what should we test next?
About the author: Michael Chachashvili is a founder of Shopping Ads Solutions and works on paid acquisition, measurement, and profitable growth systems for eCommerce and service businesses. Published July 30, 2026; updated August 6, 2026.